Category PGFplots examples (Stefan Kottwitz)
Inspired by a Twitter/X post, I started playing with the representation of orbitals with multiple lobes.
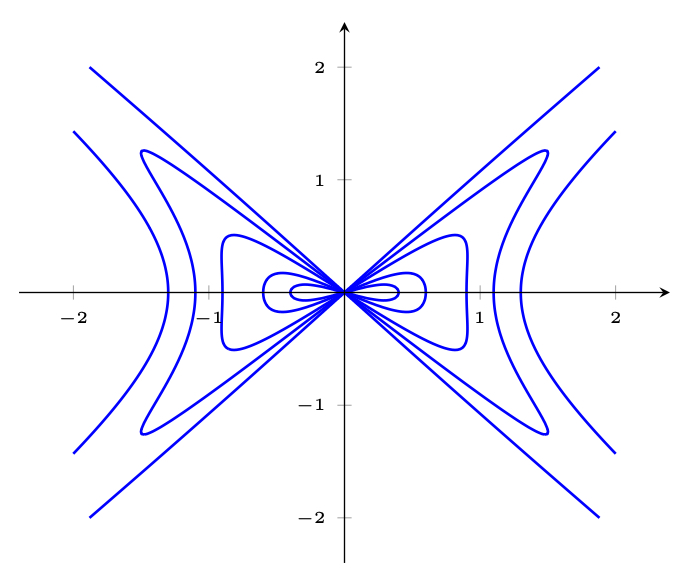
From mathcurve.com: Alain’s curve (studied by Alain Juhel) is the projection of the intersection of the elliptical cone c²z²=a²x²-b²y² with the hyperbolic paraboloid cz=x²-y² onto the xy plane: So it makes sense to plot that xy projection as 0-level contour… Continue Reading →
On X (Twitter), Juan Carlos aka @jcponcemath posts math content frequently. I saw hist post about the Aizawa attractor, a spherical-shaped attractor made from 6 parameters (a, b, …, f). Three equations generate a trajectory from an initial point. I… Continue Reading →
I saw a beautiful parametric plot on X (Twitter) by Juan Carlos, that looks like a rose, done in Desmos. Parametric surface: Rose #mathematics #surfaces #marthart #desmos https://t.co/bxFsJuKIzN pic.twitter.com/Uls6ZgWF2Y — ∞ 𝕁uan ℂarlos (@jcponcemath) February 3, 2025 Challenge accepted! I’ll… Continue Reading →
On X (Twitter), I saw a post by @clcoding demonstrating making area charts in Python. As I knew that we can do them easily with pgfplots, I did the same. We can use the ‘fillbetween’ library as follows: We can… Continue Reading →
On X (Twitter), I saw a post by @ThePhysicMemes making fun of a bear running on a jumping ball. I used this occasion to generate periodic plots with an if-condition, demonstrating also how functions can be declared: This LaTeX document… Continue Reading →
Mathieu aka @miniapeur posted another meme on X (Twitter). It contained a 3D plot of a wavy function. So I did a similar plot, but for roundness and rotational symmetry parametrized it differently so it won’t have these edgy corners…. Continue Reading →
I saw Gabriel’s Horn on X (Twitter) posted by @sonukg4india. Looks nice, so let’s plot it ourselves. We can use pgfplots to draw Gabriel’s horn quickly in LaTeX: pic.twitter.com/aoDjL3vwHw — LaTeX.org (@TeXgallery) February 3, 2025 \documentclass[border=10pt]{standalone} \usepackage{pgfplots} \pgfplotsset{compat=1.18} \begin{document} \begin{tikzpicture}… Continue Reading →
I saw tomoq’s star-shaped plot on X (Twitter), together with a pretty big implicit function definition: How to plot this? An easy way is to consider the left side as a function z=f(x,y) in three dimensions, and that equation would… Continue Reading →
The Heaviside step function, also called the unit step function, is named after Oliver Heaviside. Its value is zero for negative arguments and one for positive arguments. It can be used to represent a signal that is first switched off… Continue Reading →
A Lorenz system by Henri Menke: % !TEX lualatex \documentclass[tikz]{standalone} \usepackage{luacode,pgfplots} \begin{luacode*} — Differential equation of Lorenz attractor function f(x,y,z) local sigma = 3 local rho = 26.5 local beta = 1 return {sigma*(y-x),-x*z + rho*x – y,x*y – beta*z}… Continue Reading →
Another flower without comment. function source is here. \documentclass[border=5pt]{standalone} \usepackage{pgfplots} \pgfplotsset{compat=1.8} \renewcommand*{\r}{(sin(4*u)^3 + cos(2*u)^3 + sin(6*v)^2 + cos(6*v)^4)} \begin{document} \begin{tikzpicture} \begin{axis}[ view = {120}{310}, hide axis, colormap = {flower}{ color(0cm) = (yellow); color(4cm) = (yellow!70!red); color(8cm) = (red!60!black); color(12cm) =… Continue Reading →
Without much comments a flower, or a Parametric Breather Pseudospherical Surface. \documentclass[border=5pt]{standalone} \usepackage{pgfplots} \pgfplotsset{compat=1.8} \pgfplotsset{trig format plots=rad} \begin{document} \begin{tikzpicture} \begin{axis}[ view = {60}{-60}, hide axis, colormap = {flower}{% color(0cm) = (yellow); color(4cm) = (orange); color(8cm) = (red!40!black); color(12cm) = (red!80!black);… Continue Reading →
That’s from my German blog TikZ.de. Recently I played with the sine function, that “wave” that everybody knows in cartesian coordinates. Let’s take a look at a 3d polar complex sine made plot. In polar coordinates the sine function is… Continue Reading →
That plot is from my German blog TikZ.de. I planned to model this nice cake: (Foto by Guido Draheim). Like a cruller, just, ehm, more digital and mathematical. How do we draw it? Let’s think of a cross-section. In polar… Continue Reading →
Here I fill the space below the function z = x^2+y^2 to get a solid object. I did it by: Plotting the curves at the edges, for x=0 and y=0 Plotting the bottom edges Naming the paths above using name… Continue Reading →
The sine function is a well known periodic function. Choose an argument factor, which doesn’t divide the period well, and you can see a complicated path around the origin. This plot was originally made for my blog post on TikZ.de:… Continue Reading →
The sine function is a well known periodic function. Choose an argument factor, which doesn’t divide the period well, and add another sine function with a different factor, and you can see a complicated path around the origin. This plot… Continue Reading →
This is a picture of a Julia set, named after the French mathematician Gaston Julia. Computing requires a lot of iterations, that’s why we use Lua. The function for the set is z -> z^2 – 0.742 + 0.1i. The… Continue Reading →
The Mandelbrot consists of points whose boundary is a two-dimensional fractal shape. It is named after the mathematician Benoit Mandelbrot. It’s computed using a lot of iterations, that’s why we use Lua here for the calculation. The sampling is done… Continue Reading →
With pgfplots 1.10 and its fillbetween library we can fill the area between curves in a new convenient way: draw the first function and give it a name draw the second function and name it too add a fill between… Continue Reading →


